Observability for a fleet of one.
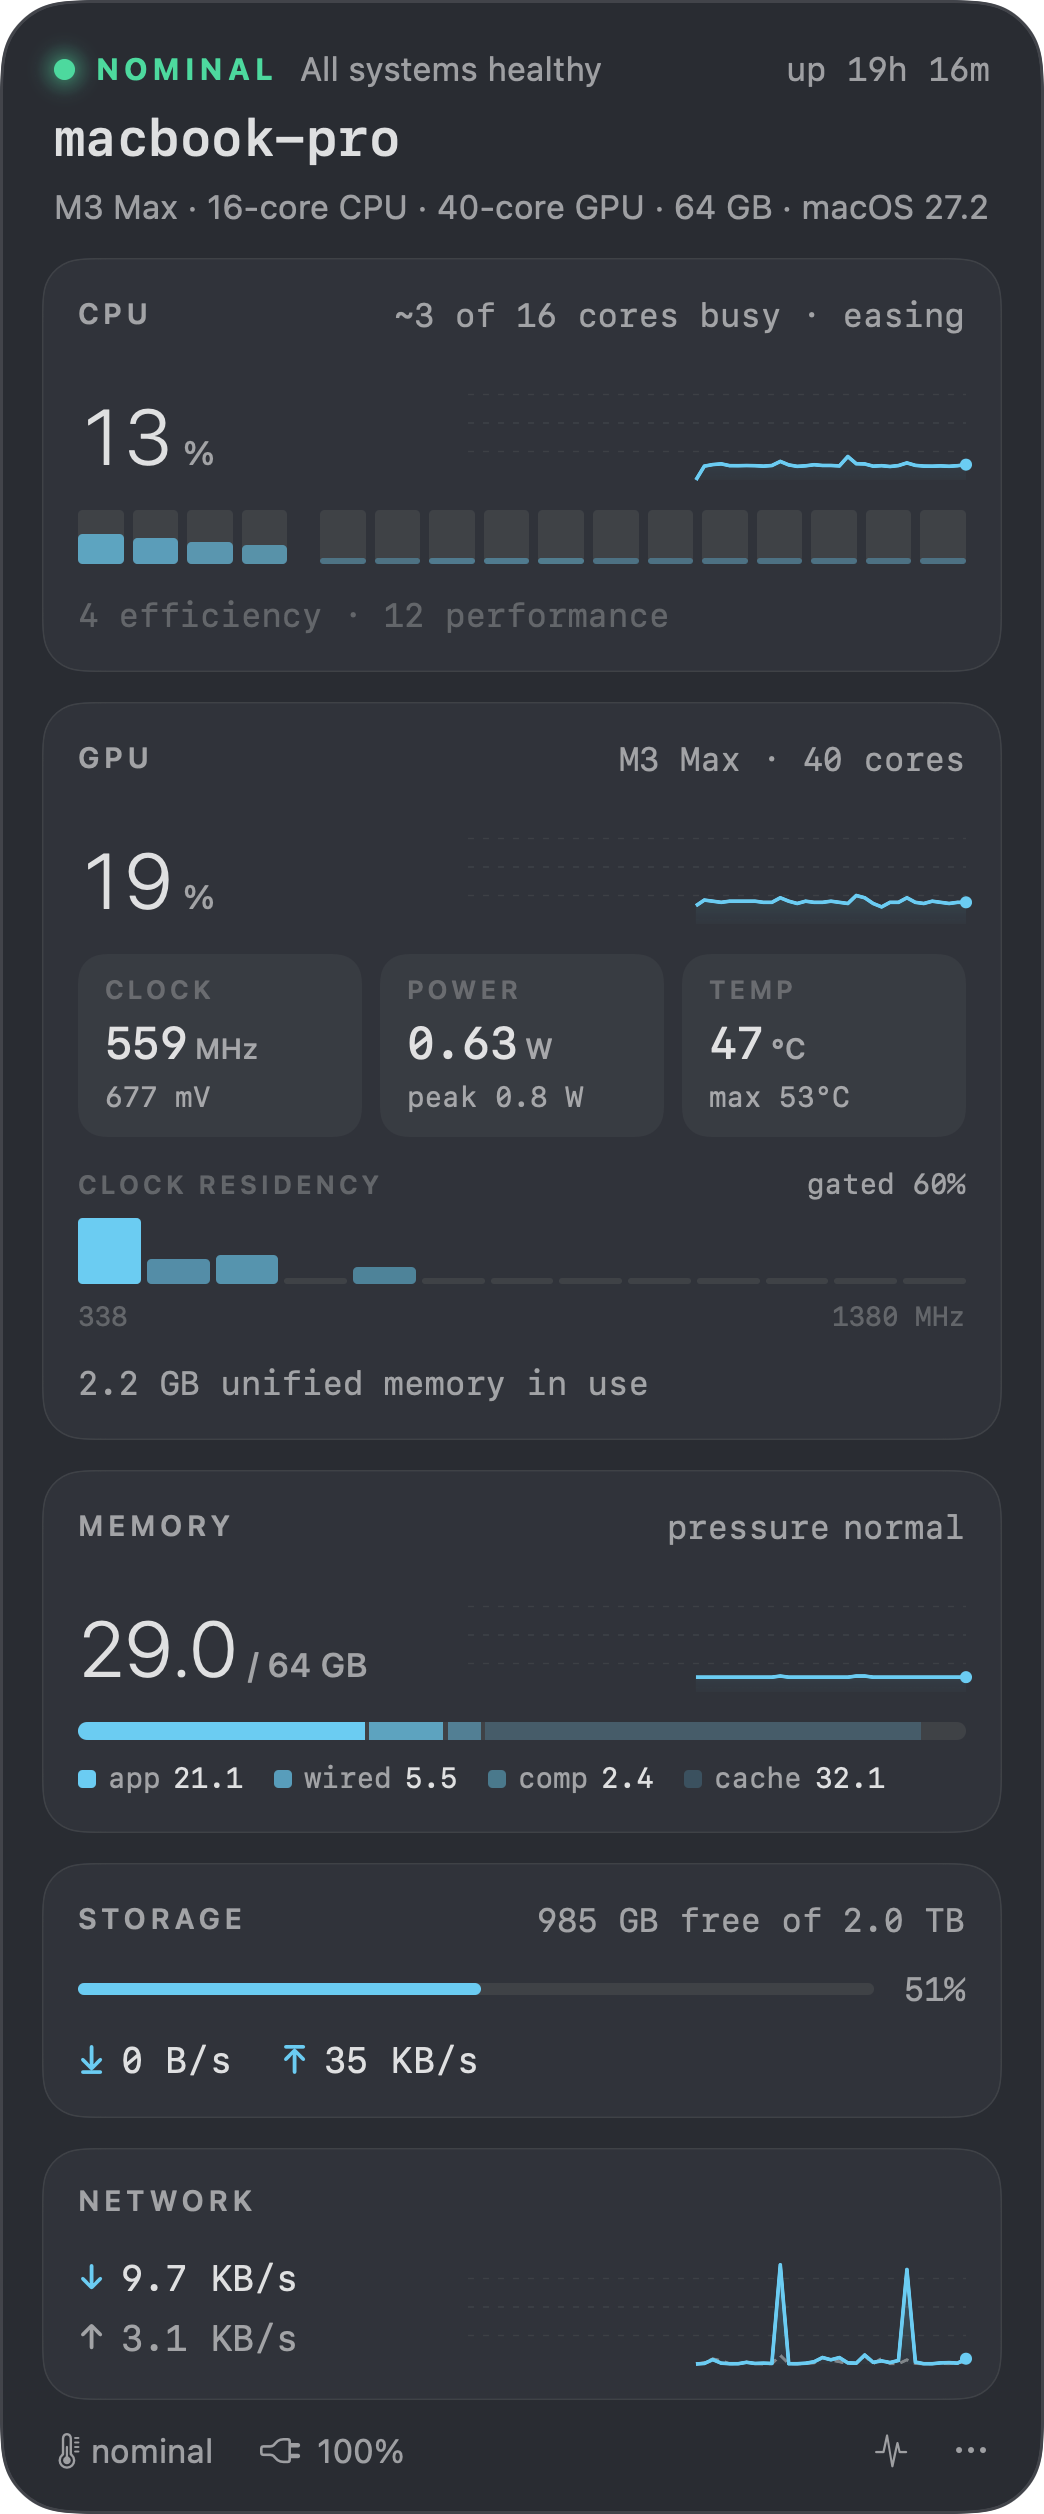
Pulse is a quiet menu bar monitor for Apple Silicon. CPU cores, GPU clocks and watts, memory pressure, disk and network: the numbers an infra engineer would want, rendered in glass.
$brew install --cask yask123/tap/pulse
- Sampling
- every 2 s · 2 min of history
- Footprint
- ~0.1% CPU · one native binary
- Privileges
- none. no root, no helper, no network
- Sources
- mach · IOKit · IOReport · SMC
- Requires
- macOS 26+ · Apple Silicon
- License
- MIT
What it watches
Compute
Load on every core, efficiency and performance set apart, and demand in plain words: “~3 of 16 cores busy · easing”.
Graphics
Utilisation, DVFS clock residency, voltage, real watts and die temperature, read straight from IOReport and the SMC.
Memory
Pressure, not just “used”. What RAM actually holds (app, wired, compressed, cache), so a full bar stops looking scary.
I/O
SSD capacity with live read/write throughput. Network in and out on physical interfaces, so VPN traffic isn't counted twice.
Health
One light. Green, amber, red, with the reason: memory pressure, swapping, thermal throttling, disk nearly full.
Explains itself
Click any number for a one-line, plain-English explanation of what it means and when to care.